2.1. Basic Operations on Images
2.1.1. Goal
Learn to:
Access pixel values and modify them
Access image properties
Setting Region of Image (ROI)
Splitting and Merging images
Almost all the operations in this section is mainly related to Numpy rather than OpenCV. A good knowledge of Numpy is required to write better optimized code with OpenCV.
( Examples will be shown in Python terminal since most of them are just single line codes )
2.1.2. Accessing and Modifying pixel values
Let’s load a color image first:
>>> import cv2
>>> import numpy as np
>>> img = cv2.imread('../../cvdata/messi5.jpg')
You can access a pixel value by its row and column coordinates. For BGR image, it returns an array of Blue, Green, Red values. For grayscale image, just corresponding intensity is returned.
>>> px = img[100,100]
>>> px
array([157, 166, 200], dtype=uint8)
>>> blue = img[100,100,0]
>>> blue
157
You can modify the pixel values the same way.
>>> img[100,100] = [255,255,255]
>>> img[100,100]
array([255, 255, 255], dtype=uint8)
Warning
Numpy is a optimized library for fast array calculations. So simply accessing each and every pixel values and modifying it will be very slow and it is discouraged.
Note
Above mentioned method is normally used for selecting a region of array,
say first 5 rows and last 3 columns like that. For individual pixel
access, Numpy array methods, array.item() and array.itemset() is
considered to be better. But it always returns a scalar. So if you want
to access all B,G,R values, you need to call array.item() separately
for all.
Better pixel accessing and editing method :
>>> # accessing RED value
>>> img.item(10,10,2)
59
>>> img.itemset((10,10,2),100)
>>> img.item(10,10,2)
100
2.1.3. Accessing Image Properties
Image properties include number of rows, columns and channels, type of image data, number of pixels etc.
Shape of image is accessed by img.shape. It returns a tuple of
number of rows, columns and channels (if image is color): :
>>> img.shape
(342, 548, 3)
Note
If image is grayscale, tuple returned contains only number of rows and columns. So it is a good method to check if loaded image is grayscale or color image.
Total number of pixels is accessed by img.size :
>>> img.size
562248
Image datatype is obtained by img.dtype :
>>> img.dtype
dtype('uint8')
Note
img.dtype is very important while debugging because a large number
of errors in OpenCV-Python code is caused by invalid datatype.
2.1.4. Image ROI
Sometimes, you will have to play with certain region of images. For eye detection in images, first perform face detection over the image until the face is found, then search within the face region for eyes. This approach improves accuracy (because eyes are always on faces :D ) and performance (because we search for a small area).
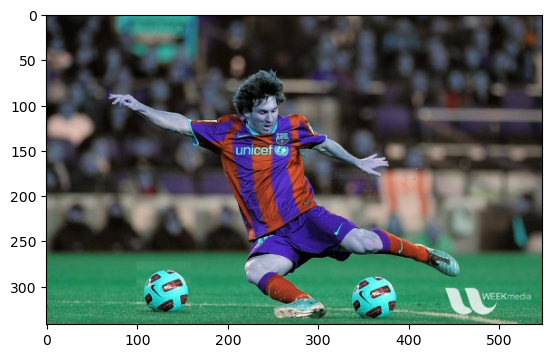
ROI is again obtained using Numpy indexing. Here I am selecting the ball and copying it to another region in the image:
>>> ball = img[280:340, 330:390]
>>> img[273:333, 100:160] = ball
>>> %matplotlib inline
>>> import  matplotlib.pyplot as plt
>>> img_2 = img[:,:,[2,1,0]]
>>> plt.imshow(img)
<matplotlib.image.AxesImage at 0x7f0bcc460d10>
>>> plt.imshow(img_2)
<matplotlib.image.AxesImage at 0x7f0bc415bb50>

>>> plt.imshow(img[:,:,[2,1,0]])
<matplotlib.image.AxesImage at 0x7f0bcc1e0950>

>>> img = cv2.cvtColor(img, cv2.COLOR_BGR2RGB) # 注意这行。
>>> plt.imshow(img)
<matplotlib.image.AxesImage at 0x7f0bcc250dd0>
>>> cv2.imwrite('xx_lena_opencv_red.jpg', img)
True

图 2.1 img
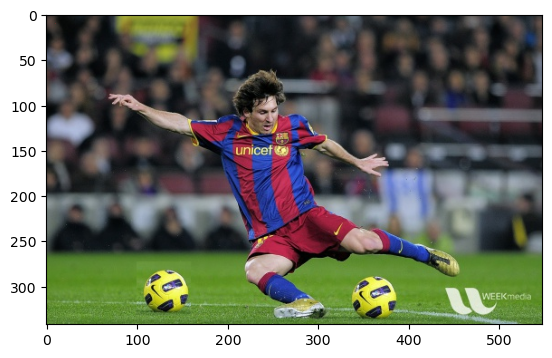
Check the results below:
2.1.5. Splitting and Merging Image Channels
The B,G,R channels of an image can be split into their individual planes when needed. Then, the individual channels can be merged back together to form a BGR image again. This can be performed by:
>>> b,g,r = cv2.split(img)
>>> img = cv2.merge((b,g,r))
Or
>>> b = img[:,:,0]
Suppose, you want to make all the red pixels to zero, you need not split like this and put it equal to zero. You can simply use Numpy indexing which is faster.
>>> img[:,:,2] = 0
Warning
cv2.split() is a costly operation (in terms of time), so only use it
if necessary. Numpy indexing is much more efficient and should be used
if possible.
2.1.6. Making Borders for Images (Padding)
If you want to create a border around the image, something like a photo frame, you can use cv2.copyMakeBorder() function. But it has more applications for convolution operation, zero padding etc. This function takes following arguments:
src - input image
top, bottom, left, right - border width in number of pixels in corresponding directions
borderType - Flag defining what kind of border to be added. It can be following types:
cv2.BORDER_CONSTANT - Adds a constant colored border. The value should be given as next argument.
cv2.BORDER_REFLECT - Border will be mirror reflection of the border elements, like this : fedcbahgfedcb
cv2.BORDER_REFLECT_101 or cv2.BORDER_DEFAULT - Same as above, but with a slight change, like this : gfedcbgfedcba
cv2.BORDER_REPLICATE - Last element is replicated throughout, like this: aaaaaahhhhhhh
cv2.BORDER_WRAP - Can’t explain, it will look like this : cdefghabcdefg
value - Color of border if border type is
cv2.BORDER_CONSTANT
Below is a sample code demonstrating all these border types for better understanding:
>>> import cv2
>>> import numpy as np
>>> from matplotlib import pyplot as plt
>>>
>>> BLUE = [255,0,0]
>>>
>>> img1 = cv2.imread('/cvdata/opencv-logo.png')
>>>
>>> replicate = cv2.copyMakeBorder(img1,10,10,10,10,cv2.BORDER_REPLICATE)
>>> reflect = cv2.copyMakeBorder(img1,10,10,10,10,cv2.BORDER_REFLECT)
>>> reflect101 = cv2.copyMakeBorder(img1,10,10,10,10,cv2.BORDER_REFLECT_101)
>>> wrap = cv2.copyMakeBorder(img1,10,10,10,10,cv2.BORDER_WRAP)
>>> constant= cv2.copyMakeBorder(img1,10,10,10,10,cv2.BORDER_CONSTANT,value=BLUE)
>>>
>>> plt.subplot(231),plt.imshow(img1,'gray'),plt.title('ORIGINAL')
>>> plt.subplot(232),plt.imshow(replicate,'gray'),plt.title('REPLICATE')
>>> plt.subplot(233),plt.imshow(reflect,'gray'),plt.title('REFLECT')
>>> plt.subplot(234),plt.imshow(reflect101,'gray'),plt.title('REFLECT_101')
>>> plt.subplot(235),plt.imshow(wrap,'gray'),plt.title('WRAP')
>>> plt.subplot(236),plt.imshow(constant,'gray'),plt.title('CONSTANT')
>>>
>>> plt.show()
[ WARN:0@8.889] global ./modules/imgcodecs/src/loadsave.cpp (239) findDecoder imread_('/cvdata/opencv-logo.png'): can't open/read file: check file path/integrity
See the result below. (Image is displayed with matplotlib. So RED and BLUE planes will be interchanged):
>>> image = plt.imread('/cvdata/opencv-logo.png')
>>> plt.imshow(image)